Population by state
Residents counted in the 2011 Census.
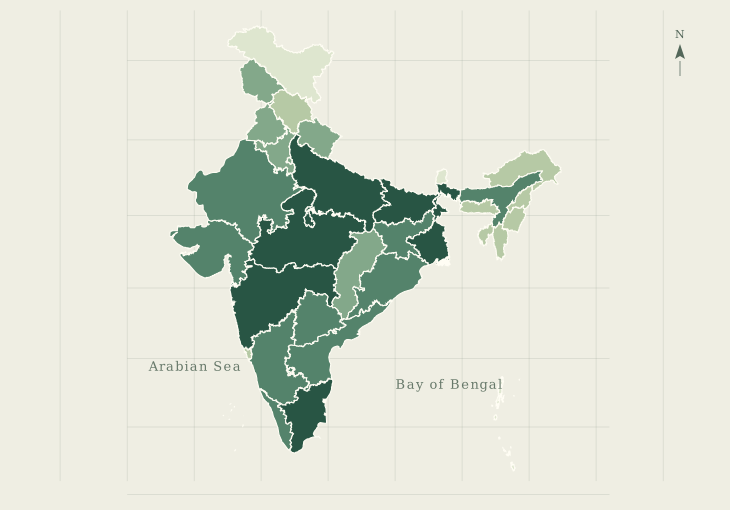
< 10 lakh10 lakh to < 1 cr1 to < 3 cr3 to < 7 cr≥ 7 cr
Explore how India lived, learned and worked at the last completed census. Compare official figures across 36 states and union territories.
Choose a measure, then select a state or union territory to see its figures.
Residents counted in the 2011 Census.
Dashed line marks the mean population per state or UT.
Final Census 2011 figures for India.
One dot per state or UT. Dot area represents population.
Compare final 2011 counts and separately labelled 2026 projections for all 36 regions. Select a place to open its profile.
| Top languages by mother tongue (2011) | |||||||||||||||||||||||||||||||||||||||||||||
|---|---|---|---|---|---|---|---|---|---|---|---|---|---|---|---|---|---|---|---|---|---|---|---|---|---|---|---|---|---|---|---|---|---|---|---|---|---|---|---|---|---|---|---|---|---|
| Andaman and Nicobar Islands | 3,80,581 | 4,07,000 | 2,02,871 | 1,77,710 | 40,878 | 86.63% | 90.27% | 82.43% | 7.84 pp | 876 | 968 | 37.7% | 62.3% | 1,43,488 | 2,37,093 | 46 | 8,249 | 6.86% | 40.08% | 82.54% | 17.46% | 10.86% | 3.13% | 2.44% | 83.56% | 86.13% | 68.85% | 85.01% | 70.09% | 44.56% | 89.28% | 0% | 7.5% | 69.45% | 8.52% | 21.28% | 0.34% | 0.09% | 0.01% | 0.15% | 0.18% | 2,14,000 | 1,93,000 | 46.19% | Bengali 28.49% · Hindi 19.29% · Tamil 15.2% · Telugu 13.24% · Nicobarese 7.6% |
| Andhra Pradesh* | 4,95,77,103 | 5,37,63,000 | 2,48,30,513 | 2,47,46,590 | 52,43,636 | 67.35% | 74.77% | 59.96% | 14.81 pp | 997 | 944 | 29.47% | 70.53% | 1,46,10,410 | 3,49,66,693 | 304 | 1,62,970 | 9.21% | 46.56% | 83.69% | 16.31% | 14.47% | 47.89% | 2.87% | 34.77% | 92.11% | 48.73% | 67.34% | 47.67% | 36.05% | 52.75% | 17.08% | 5.53% | 90.87% | 7.33% | 1.38% | 0.02% | 0.01% | 0.05% | 0.01% | 0.33% | 2,68,57,000 | 2,69,06,000 | 38.67% | Telugu 89.38% · Urdu 6.57% · Tamil 1.16% · Hindi 0.86% · Kannada 0.67% |
| Arunachal Pradesh | 13,83,727 | 16,11,000 | 7,13,912 | 6,69,815 | 2,12,188 | 65.38% | 72.55% | 57.7% | 14.85 pp | 938 | 972 | 22.94% | 77.06% | 3,17,369 | 10,66,358 | 17 | 83,743 | 26.03% | 42.47% | 81.46% | 18.54% | 51.51% | 6.16% | 1.42% | 40.91% | 65.68% | 26.42% | 65.54% | 61.97% | 29.47% | 53.03% | 0% | 68.79% | 29.04% | 1.95% | 30.26% | 0.24% | 11.77% | 0.06% | 26.2% | 0.48% | 8,27,000 | 7,84,000 | 26.44% | Nissi/Dafla 28.6% · Adi 17.35% · Bengali 7.27% · Hindi 7.1% · Nepali 6.89% |
| Assam | 3,12,05,576 | 3,68,89,000 | 1,59,39,443 | 1,52,66,133 | 46,38,130 | 72.19% | 77.85% | 66.27% | 11.58 pp | 958 | 962 | 14.1% | 85.9% | 43,98,542 | 2,68,07,034 | 398 | 78,438 | 17.07% | 38.36% | 72.58% | 27.42% | 33.93% | 15.42% | 4.1% | 46.55% | 37.05% | 9.15% | 10.46% | 64.89% | 19.12% | 44.09% | 7.15% | 12.45% | 61.47% | 34.22% | 3.74% | 0.07% | 0.18% | 0.08% | 0.09% | 0.16% | 1,87,44,000 | 1,81,45,000 | 16% | Assamese 48.38% · Bengali 28.92% · Hindi 6.73% · Bodo 4.54% · Miri/Mishing 1.98% |
| Bihar | 10,40,99,452 | 13,32,89,000 | 5,42,78,157 | 4,98,21,295 | 1,91,33,964 | 61.8% | 71.2% | 51.5% | 19.7 pp | 918 | 935 | 11.29% | 88.71% | 1,17,58,016 | 9,23,41,436 | 1,106 | 94,163 | 25.42% | 33.36% | 61.51% | 38.49% | 20.72% | 52.83% | 4.06% | 22.38% | 16.36% | 3.07% | 4.41% | 23.06% | 8.44% | 44.4% | 15.91% | 1.28% | 82.69% | 16.87% | 0.12% | 0.02% | 0.02% | 0.02% | 0.01% | 0.24% | 6,91,58,000 | 6,41,31,000 | 12.56% | Hindi 77.52% · Maithili 12.55% · Urdu 8.42% · Bengali 0.78% · Santali 0.44% |
| Chandigarh | 10,55,450 | 12,73,000 | 5,80,663 | 4,74,787 | 1,19,434 | 86.05% | 89.99% | 81.19% | 8.8 pp | 818 | 880 | 97.25% | 2.75% | 10,26,459 | 28,991 | 9,258 | 114 | 17.19% | 38.29% | 95.49% | 4.51% | 0.64% | 0.42% | 1.19% | 97.76% | 98.36% | 93.7% | 96.72% | 87.64% | 71.71% | 80.11% | 18.86% | 0% | 80.78% | 4.87% | 0.83% | 13.11% | 0.11% | 0.19% | 0.02% | 0.1% | 6,84,000 | 5,89,000 | 100% | Hindi 73.6% · Punjabi 22.03% · Urdu 1.0% · Nepali 0.62% · Bengali 0.59% |
| Chhattisgarh | 2,55,45,198 | 3,13,87,000 | 1,28,32,895 | 1,27,12,303 | 36,61,689 | 70.28% | 80.27% | 60.24% | 20.03 pp | 991 | 969 | 23.24% | 76.76% | 59,37,237 | 1,96,07,961 | 189 | 1,35,192 | 22.61% | 47.68% | 67.66% | 32.34% | 32.88% | 41.8% | 1.54% | 23.78% | 75.26% | 12.28% | 20.65% | 24.59% | 11.47% | 48.8% | 12.82% | 30.62% | 93.25% | 2.02% | 1.92% | 0.27% | 0.28% | 0.24% | 1.94% | 0.09% | 1,57,39,000 | 1,56,48,000 | 28.26% | Hindi 83.62% · Gondi 4.19% · Odia 3.58% · Halabi 2.76% · Kurukh/Oraon 2.02% |
| Dadra and Nagar Haveli and Daman and Diu | 5,86,956 | 16,32,000 | 3,44,061 | 2,42,895 | 77,829 | 80.85% | 88.03% | 70.25% | 17.78 pp | 706 | 918 | 58.51% | 41.49% | 3,43,446 | 2,43,510 | 975 | 602 | 54.99% | 47.44% | 88.62% | 11.38% | 10.95% | 6.67% | 1.03% | 81.35% | 96.96% | 38.95% | 59.5% | 65.37% | 46.49% | 60.65% | 2.1% | 33.04% | 92.51% | 5.49% | 1.35% | 0.07% | 0.14% | 0.25% | 0.06% | 0.12% | 11,17,000 | 5,14,000 | 84.8% | Gujarati 33.64% · Hindi 30.36% · Bhili/Bhilodi 21.91% · Marathi 5.98% · Odia 1.51% |
| Delhi | 1,67,87,941 | 2,27,75,000 | 89,87,326 | 78,00,615 | 20,12,454 | 86.21% | 90.94% | 80.76% | 10.18 pp | 868 | 871 | 97.5% | 2.5% | 1,63,68,899 | 4,19,042 | 11,320 | 1,483 | 21.21% | 33.28% | 94.99% | 5.01% | 0.6% | 0.71% | 3.25% | 95.44% | 99.11% | 75.19% | 81.33% | 89.53% | 90.06% | 77.69% | 16.75% | 0% | 81.68% | 12.86% | 0.87% | 3.4% | 0.11% | 0.99% | 0.01% | 0.08% | 1,20,88,000 | 1,06,87,000 | 99.84% | Hindi 84.92% · Punjabi 5.2% · Urdu 5.17% · Bengali 1.29% · Maithili 0.73% |
| Goa | 14,58,545 | 16,03,000 | 7,39,140 | 7,19,405 | 1,44,611 | 88.7% | 92.65% | 84.66% | 7.99 pp | 973 | 942 | 62.17% | 37.83% | 9,06,814 | 5,51,731 | 394 | 3,702 | 8.23% | 39.58% | 82.47% | 17.53% | 5.43% | 4.64% | 2.55% | 87.38% | 96.89% | 82.05% | 85.4% | 79.72% | 73.16% | 86.82% | 1.74% | 10.23% | 66.08% | 8.33% | 25.1% | 0.1% | 0.08% | 0.08% | 0.02% | 0.21% | 8,06,000 | 7,97,000 | 79.48% | Konkani 66.11% · Marathi 10.89% · Hindi 10.29% · Kannada 4.66% · Urdu 2.83% |
| Gujarat | 6,04,39,692 | 7,45,35,000 | 3,14,91,260 | 2,89,48,432 | 77,77,262 | 78.03% | 85.75% | 69.68% | 16.07 pp | 919 | 890 | 42.6% | 57.4% | 2,57,45,083 | 3,46,94,609 | 308 | 1,96,244 | 19.28% | 40.98% | 82.23% | 17.77% | 21.99% | 27.61% | 1.39% | 49% | 90.41% | 39.85% | 69.03% | 57.35% | 39.26% | 57.87% | 6.74% | 14.75% | 88.57% | 9.67% | 0.52% | 0.1% | 0.05% | 0.96% | 0.03% | 0.1% | 3,91,70,000 | 3,53,65,000 | 50.49% | Gujarati 85.97% · Hindi 7.06% · Sindhi 1.96% · Marathi 1.52% · Bhili/Bhilodi 1.37% |
| Haryana | 2,53,51,462 | 3,14,91,000 | 1,34,94,734 | 1,18,56,728 | 33,80,721 | 75.55% | 84.06% | 65.94% | 18.11 pp | 879 | 834 | 34.88% | 65.12% | 88,42,103 | 1,65,09,359 | 573 | 44,212 | 19.9% | 35.17% | 78.68% | 21.32% | 27.82% | 17.14% | 2.94% | 52.1% | 90.51% | 55.86% | 68.79% | 68.63% | 44.28% | 68.13% | 20.17% | 0% | 87.46% | 7.03% | 0.2% | 4.91% | 0.03% | 0.21% | 0.01% | 0.17% | 1,66,23,000 | 1,48,69,000 | 44.18% | Hindi 88.05% · Punjabi 9.47% · Urdu 1.48% · Bengali 0.28% · Lahnda 0.12% |
| Himachal Pradesh | 68,64,602 | 75,95,000 | 34,81,873 | 33,82,729 | 7,77,898 | 82.8% | 89.53% | 75.93% | 13.61 pp | 972 | 909 | 10.03% | 89.97% | 6,88,552 | 61,76,050 | 123 | 55,673 | 12.94% | 51.85% | 57.94% | 42.06% | 57.93% | 4.92% | 1.65% | 35.5% | 96.76% | 83.93% | 89.49% | 69.11% | 38.81% | 89.12% | 25.19% | 5.71% | 95.17% | 2.18% | 0.18% | 1.16% | 1.15% | 0.03% | 0.01% | 0.12% | 38,50,000 | 37,45,000 | 10.39% | Hindi 85.88% · Punjabi 8.96% · Nepali 1.3% · Kinnauri 1.2% · Kashmiri 0.83% |
| Jammu and Kashmir | 1,22,67,013 | 1,39,50,000 | 64,83,906 | 57,83,107 | 19,86,961 | 67% | 76.55% | 56.36% | 20.18 pp | 892 | 860 | 27.48% | 72.52% | 33,71,233 | 88,95,780 | 290 | 42,241 | 23.82% | 34.2% | 60.97% | 39.03% | 28.99% | 12.92% | 4.06% | 54.03% | 85.14% | 35.18% | 64.34% | 50.35% | 32.45% | 69.75% | 7.54% | 10.39% | 28.8% | 68.8% | 0.28% | 1.9% | 0.03% | 0.02% | 0.01% | 0.15% | 72,81,000 | 66,69,000 | 31.47% | Kashmiri 54.44% · Hindi 21.09% · Dogri 20.48% · Punjabi 1.76% · Khandeshi 0.28% |
| Jharkhand | 3,29,88,134 | 4,12,21,000 | 1,69,30,315 | 1,60,57,819 | 53,89,495 | 66.41% | 76.84% | 55.42% | 21.42 pp | 948 | 948 | 24.05% | 75.95% | 79,33,061 | 2,50,55,073 | 414 | 79,716 | 22.42% | 39.71% | 52.06% | 47.94% | 29.12% | 33.87% | 3.47% | 33.53% | 45.78% | 9.97% | 12.87% | 22.03% | 12.11% | 53.95% | 12.08% | 26.21% | 67.83% | 14.53% | 4.3% | 0.22% | 0.03% | 0.05% | 12.84% | 0.21% | 2,10,61,000 | 2,01,59,000 | 26.79% | Hindi 61.95% · Santali 9.91% · Bengali 9.74% · Urdu 5.96% · Ho 3.01% |
| Karnataka | 6,10,95,297 | 6,91,59,000 | 3,09,66,657 | 3,01,28,640 | 71,61,033 | 75.36% | 82.47% | 68.08% | 14.39 pp | 973 | 948 | 38.67% | 61.33% | 2,36,25,962 | 3,74,69,335 | 319 | 1,91,791 | 15.6% | 45.62% | 83.94% | 16.06% | 23.61% | 25.67% | 3.28% | 47.44% | 90.63% | 41.22% | 66.06% | 51.21% | 33.52% | 61.11% | 17.15% | 6.95% | 84% | 12.92% | 1.87% | 0.05% | 0.16% | 0.72% | 0.02% | 0.27% | 3,50,87,000 | 3,40,72,000 | 46.13% | Kannada 66.54% · Urdu 10.83% · Telugu 5.84% · Tamil 3.45% · Marathi 3.38% |
| Kerala | 3,34,06,061 | 3,62,63,000 | 1,60,27,412 | 1,73,78,649 | 34,72,955 | 94% | 96.11% | 92.07% | 4.04 pp | 1,084 | 964 | 47.7% | 52.3% | 1,59,34,926 | 1,74,71,135 | 860 | 38,852 | 4.91% | 34.78% | 80.3% | 19.7% | 5.77% | 11.39% | 2.35% | 80.5% | 94.41% | 23.36% | 29.34% | 95.2% | 36.51% | 74.24% | 9.1% | 1.45% | 54.73% | 26.56% | 18.38% | 0.01% | 0.01% | 0.01% | 0.02% | 0.26% | 1,74,23,000 | 1,88,40,000 | 82.49% | Malayalam 97.03% · Tamil 1.5% · Tulu 0.37% · Kannada 0.26% · Konkani 0.21% |
| Ladakh | 2,74,289 | 3,06,000 | 1,56,756 | 1,17,533 | 31,944 | 74.28% | 84.79% | 59.77% | 25.02 pp | 750 | 966 | 22.61% | 77.39% | 62,009 | 2,12,280 | 5 | 59,146 | 15.96% | 46.28% | 67.79% | 32.21% | 22.95% | 4.26% | 1.77% | 71.02% | 84.83% | 10.01% | 43.66% | 93.43% | 43.88% | 82.63% | 0.18% | 79.55% | 12.11% | 46.41% | 0.46% | 0.83% | 39.65% | 0.05% | 0.02% | 0.47% | 1,71,000 | 1,35,000 | 33.66% | Bhotia 38.35% · Tibetan 35.94% · Hindi 9.36% · Shina 4.3% · Balti 3.58% |
| Lakshadweep | 64,473 | 70,000 | 33,123 | 31,350 | 7,255 | 91.85% | 95.56% | 87.95% | 7.61 pp | 946 | 911 | 78.07% | 21.93% | 50,332 | 14,141 | 2,149 | 30 | 6.3% | 29.09% | 57.61% | 42.39% | 0% | 0% | 1.41% | 98.59% | 99.68% | 9.12% | 20.26% | 97.8% | 18.01% | 85.28% | 0% | 94.8% | 2.77% | 96.58% | 0.49% | 0.01% | 0.02% | 0.02% | 0.01% | 0.1% | 36,000 | 34,000 | 100% | Malayalam 84.17% · Tamil 0.56% · Hindi 0.25% · Bengali 0.22% · Telugu 0.07% |
| Madhya Pradesh | 7,26,26,809 | 9,01,84,000 | 3,76,12,306 | 3,50,14,503 | 1,08,09,395 | 69.32% | 78.73% | 59.24% | 19.49 pp | 931 | 918 | 27.63% | 72.37% | 2,00,69,405 | 5,25,57,404 | 236 | 3,08,252 | 20.35% | 43.47% | 71.9% | 28.1% | 31.18% | 38.61% | 3.04% | 27.17% | 67.11% | 16.45% | 23.36% | 28.82% | 18.55% | 46.6% | 15.62% | 21.09% | 90.89% | 6.57% | 0.29% | 0.21% | 0.3% | 0.78% | 0.83% | 0.13% | 4,64,06,000 | 4,37,78,000 | 29.38% | Hindi 88.57% · Bhili/Bhilodi 4.94% · Marathi 1.7% · Gondi 1.6% · Urdu 1.26% |
| Maharashtra | 11,23,74,333 | 12,97,91,000 | 5,82,43,056 | 5,41,31,277 | 1,33,26,517 | 82.34% | 88.38% | 75.87% | 12.51 pp | 929 | 894 | 45.22% | 54.78% | 5,08,18,259 | 6,15,56,074 | 365 | 3,07,713 | 15.99% | 43.99% | 88.54% | 11.46% | 25.43% | 27.28% | 2.48% | 44.81% | 83.94% | 56.34% | 67.89% | 53.1% | 44.1% | 68.88% | 11.81% | 9.35% | 79.83% | 11.54% | 0.96% | 0.2% | 5.81% | 1.25% | 0.16% | 0.25% | 6,75,48,000 | 6,22,44,000 | 49.51% | Marathi 68.93% · Hindi 12.89% · Urdu 6.71% · Gujarati 2.11% · Bhili/Bhilodi 2.0% |
| Manipur | 28,55,794 | 33,24,000 | 14,38,586 | 14,17,208 | 3,75,357 | 76.94% | 83.58% | 70.26% | 13.33 pp | 985 | 930 | 29.21% | 70.79% | 8,34,154 | 20,21,640 | 128 | 22,327 | 24.5% | 45.68% | 74.67% | 25.33% | 44% | 8.81% | 7% | 40.19% | 69.32% | 24.71% | 38.8% | 87.03% | 27.88% | 28.64% | 3.41% | 40.88% | 41.39% | 8.4% | 41.29% | 0.05% | 0.25% | 0.06% | 8.19% | 0.38% | 16,66,000 | 16,59,000 | 33.42% | Manipuri 53.3% · Mao 7.86% · Thado 7.84% · Tangkhul 6.41% · Kabui 3.84% |
| Meghalaya | 29,66,889 | 34,54,000 | 14,91,832 | 14,75,057 | 5,68,536 | 74.43% | 75.95% | 72.89% | 3.07 pp | 989 | 970 | 20.07% | 79.93% | 5,95,450 | 23,71,439 | 132 | 22,429 | 27.95% | 39.96% | 77.73% | 22.27% | 41.72% | 16.73% | 1.73% | 39.82% | 60.92% | 27.81% | 39.26% | 62.91% | 13.59% | 37.49% | 0.58% | 86.15% | 11.53% | 4.4% | 74.59% | 0.1% | 0.33% | 0.02% | 8.71% | 0.32% | 17,28,000 | 17,26,000 | 20.85% | Khasi 46.59% · Garo 31.56% · Bengali 7.84% · Hindi 2.12% · Nepali 1.84% |
| Mizoram | 10,97,206 | 12,77,000 | 5,55,339 | 5,41,867 | 1,68,531 | 91.33% | 93.35% | 89.27% | 4.08 pp | 976 | 970 | 52.11% | 47.89% | 5,71,771 | 5,25,435 | 52 | 21,081 | 23.48% | 44.36% | 85.27% | 14.73% | 47.17% | 8.59% | 1.61% | 42.63% | 84.2% | 39.44% | 58.72% | 91.91% | 52.8% | 54.86% | 0.11% | 94.43% | 2.75% | 1.35% | 87.16% | 0.03% | 8.51% | 0.03% | 0.07% | 0.09% | 6,43,000 | 6,34,000 | 55.91% | Lushai/Mizo 73.16% · Bengali 9.83% · Lakher 3.82% · Tripuri 2.97% · Pawi 2.61% |
| Nagaland | 19,78,502 | 23,03,000 | 10,24,649 | 9,53,853 | 2,91,071 | 79.55% | 82.75% | 76.11% | 6.64 pp | 931 | 943 | 28.86% | 71.14% | 5,70,966 | 14,07,536 | 119 | 16,579 | -0.58% | 49.24% | 76.09% | 23.91% | 55.2% | 6.46% | 2.34% | 35.99% | 81.61% | 6.08% | 47.15% | 76.52% | 20.18% | 34.88% | 0% | 86.48% | 8.75% | 2.47% | 87.93% | 0.1% | 0.34% | 0.13% | 0.16% | 0.12% | 11,87,000 | 11,16,000 | 51.02% | Konyak 12.34% · Ao 11.68% · Lotha 8.97% · Angami 7.68% · Chakru/Chokri 4.6% |
| Odisha | 4,19,74,218 | 4,47,16,000 | 2,12,12,136 | 2,07,62,082 | 52,73,194 | 72.87% | 81.59% | 64.01% | 17.58 pp | 979 | 941 | 16.69% | 83.31% | 70,03,656 | 3,49,70,562 | 270 | 1,55,707 | 14.05% | 41.79% | 61.04% | 38.96% | 23.4% | 38.42% | 4.46% | 33.72% | 43.02% | 9.98% | 13.84% | 22.04% | 10.42% | 45.04% | 17.13% | 22.85% | 93.63% | 2.17% | 2.77% | 0.05% | 0.03% | 0.02% | 1.14% | 0.18% | 2,11,91,000 | 2,35,25,000 | 19.58% | Odia 82.7% · Hindi 2.95% · Kui 2.24% · Santali 2.06% · Urdu 1.6% |
| Puducherry | 12,47,953 | 17,81,000 | 6,12,511 | 6,35,442 | 1,32,858 | 85.85% | 91.26% | 80.67% | 10.59 pp | 1,037 | 967 | 68.33% | 31.67% | 8,52,753 | 3,95,200 | 2,547 | 490 | 28.08% | 35.66% | 89.82% | 10.18% | 2.72% | 15.37% | 1.77% | 80.14% | 97.65% | 90.8% | 95.27% | 68.45% | 70.69% | 63.96% | 15.73% | 0% | 87.3% | 6.05% | 6.29% | 0.02% | 0.04% | 0.11% | 0.01% | 0.17% | 8,39,000 | 9,42,000 | 70.69% | Tamil 88.22% · Telugu 5.96% · Malayalam 3.84% · Urdu 0.69% · Hindi 0.51% |
| Punjab | 2,77,43,338 | 3,14,08,000 | 1,46,39,465 | 1,31,03,873 | 30,76,219 | 75.84% | 80.44% | 70.73% | 9.71 pp | 895 | 846 | 37.48% | 62.52% | 1,03,99,146 | 1,73,44,192 | 551 | 50,362 | 13.89% | 35.67% | 85.39% | 14.61% | 19.55% | 16.05% | 3.9% | 60.51% | 96.6% | 41.1% | 50.98% | 79.29% | 55.94% | 65.21% | 31.94% | 0% | 38.49% | 1.93% | 1.26% | 57.69% | 0.12% | 0.16% | 0.04% | 0.32% | 1,64,66,000 | 1,49,42,000 | 43.13% | Punjabi 89.82% · Hindi 9.35% · Urdu 0.1% · Bengali 0.1% · Lahnda 0.09% |
| Rajasthan | 6,85,48,437 | 8,40,57,000 | 3,55,50,997 | 3,29,97,440 | 1,06,49,504 | 66.11% | 79.19% | 52.12% | 27.07 pp | 928 | 888 | 24.87% | 75.13% | 1,70,48,085 | 5,15,00,352 | 200 | 3,42,239 | 21.31% | 43.6% | 70.46% | 29.54% | 45.57% | 16.53% | 2.41% | 35.49% | 67% | 32.04% | 40.58% | 34.97% | 22.96% | 68.02% | 17.83% | 13.48% | 88.49% | 9.07% | 0.14% | 1.27% | 0.02% | 0.91% | 0.01% | 0.1% | 4,29,85,000 | 4,10,71,000 | 27.12% | Hindi 89.39% · Bhili/Bhilodi 5.24% · Punjabi 3.32% · Urdu 0.97% · Sindhi 0.56% |
| Sikkim | 6,10,577 | 7,11,000 | 3,23,070 | 2,87,507 | 64,111 | 81.42% | 86.55% | 75.61% | 10.94 pp | 890 | 957 | 25.15% | 74.85% | 1,53,578 | 4,56,999 | 86 | 7,096 | 12.89% | 50.47% | 74.77% | 25.23% | 38.1% | 8.43% | 1.67% | 51.8% | 92.54% | 29.2% | 85.28% | 87.2% | 41.61% | 67.48% | 4.63% | 33.8% | 57.76% | 1.62% | 9.91% | 0.31% | 27.39% | 0.05% | 2.67% | 0.3% | 3,74,000 | 3,36,000 | 56.4% | Nepali 62.6% · Hindi 7.96% · Bhotia 6.86% · Limbu 6.34% · Lepcha 6.27% |
| Tamil Nadu | 7,21,47,030 | 7,76,09,000 | 3,61,37,975 | 3,60,09,055 | 74,23,832 | 80.09% | 86.77% | 73.44% | 13.33 pp | 996 | 943 | 48.4% | 51.6% | 3,49,17,440 | 3,72,29,590 | 555 | 1,30,060 | 15.61% | 45.58% | 84.97% | 15.03% | 12.92% | 29.21% | 4.15% | 53.72% | 93.36% | 55.83% | 79.77% | 48.29% | 48.3% | 52.52% | 20.01% | 1.1% | 87.58% | 5.86% | 6.12% | 0.02% | 0.02% | 0.12% | 0.01% | 0.26% | 3,86,75,000 | 3,89,34,000 | 55.29% | Tamil 88.37% · Telugu 5.87% · Kannada 1.78% · Urdu 1.75% · Malayalam 1.01% |
| Telangana* | 3,50,03,674 | 3,86,93,000 | 1,76,11,633 | 1,73,92,041 | 38,99,166 | 66.54% | 75.04% | 57.99% | 17.05 pp | 988 | 932 | 38.88% | 61.12% | 1,36,08,665 | 2,13,95,009 | 312 | 1,12,077 | 13.58% | 46.69% | 83.96% | 16.04% | 19.28% | 36.2% | 4.75% | 39.77% | 92.25% | 49.36% | 73.68% | 52.44% | 37.31% | 53.62% | 15.45% | 9.08% | 85.1% | 12.69% | 1.27% | 0.09% | 0.09% | 0.08% | 0.02% | 0.68% | 1,94,42,000 | 1,92,51,000 | 50.23% | Telugu 75.37% · Urdu 12.11% · Hindi 7.65% · Marathi 1.76% · Koya 0.64% |
| Tripura | 36,73,917 | 42,77,000 | 18,74,376 | 17,99,541 | 4,58,014 | 87.22% | 91.53% | 82.73% | 8.8 pp | 960 | 957 | 26.17% | 73.83% | 9,61,453 | 27,12,464 | 350 | 10,486 | 14.84% | 40% | 73.29% | 26.71% | 20.14% | 24.06% | 2.82% | 52.97% | 68.44% | 20.31% | 33.2% | 86.04% | 17.74% | 79.23% | 17.83% | 31.76% | 83.4% | 8.6% | 4.35% | 0.03% | 3.41% | 0.02% | 0.04% | 0.14% | 21,71,000 | 21,06,000 | 43.25% | Bengali 65.73% · Tripuri 25.88% · Hindi 2.11% · Mogh 0.97% · Odia 0.71% |
| Uttar Pradesh | 19,98,12,341 | 24,39,21,000 | 10,44,80,510 | 9,53,31,831 | 3,07,91,331 | 67.68% | 77.28% | 57.18% | 20.1 pp | 912 | 902 | 22.27% | 77.73% | 4,44,95,063 | 15,53,17,278 | 829 | 2,40,928 | 20.23% | 32.94% | 67.82% | 32.18% | 28.96% | 30.3% | 5.92% | 34.82% | 36.81% | 20.21% | 27.26% | 35.65% | 19.16% | 72.02% | 20.7% | 0.57% | 79.73% | 19.26% | 0.18% | 0.32% | 0.1% | 0.11% | 0.01% | 0.29% | 12,68,46,000 | 11,70,75,000 | 24.54% | Hindi 94.08% · Urdu 5.42% · Punjabi 0.25% · Bengali 0.12% · Sindhi 0.01% |
| Uttarakhand | 1,00,86,292 | 1,20,55,000 | 51,37,773 | 49,48,519 | 13,55,814 | 78.82% | 87.4% | 70.01% | 17.4 pp | 963 | 890 | 30.23% | 69.77% | 30,49,338 | 70,36,954 | 189 | 53,483 | 18.81% | 38.39% | 74.13% | 25.87% | 40.81% | 10.42% | 2.95% | 45.82% | 87.04% | 53.93% | 68.22% | 65.77% | 44.74% | 80.71% | 18.76% | 2.89% | 82.97% | 13.95% | 0.37% | 2.34% | 0.15% | 0.09% | 0.01% | 0.12% | 61,84,000 | 58,70,000 | 37.57% | Hindi 89.15% · Urdu 4.22% · Punjabi 2.61% · Bengali 1.5% · Nepali 1.05% |
| West Bengal | 9,12,76,115 | 10,07,14,000 | 4,68,09,027 | 4,44,67,088 | 1,05,81,466 | 76.26% | 81.69% | 70.54% | 11.15 pp | 950 | 956 | 31.87% | 68.13% | 2,90,93,002 | 6,21,83,113 | 1,028 | 88,752 | 13.84% | 38.08% | 73.9% | 26.1% | 14.72% | 29.32% | 7.09% | 48.87% | 54.49% | 21.04% | 25.42% | 58.85% | 18.29% | 48.75% | 23.51% | 5.8% | 70.54% | 27.01% | 0.72% | 0.07% | 0.31% | 0.07% | 1.03% | 0.25% | 5,12,59,000 | 4,94,54,000 | 38.3% | Bengali 86.22% · Hindi 6.96% · Santali 2.66% · Urdu 1.82% · Nepali 1.27% |
Scroll the table for more measures. * Housing, religion, language and growth for Andhra Pradesh and Telangana use whole 2011 districts. See the boundary notes.
Uttar Pradesh counted 19.98 crore people, the largest population of any state. Maharashtra followed at 11.24 crore and Bihar at 10.41 crore.
Kerala led the states at 94.0% literacy. Bihar recorded 61.8%, the lowest state rate. The national male–female gap was about 16 percentage points.
Kerala recorded 1,084 females per 1,000 males. The combined territory of Dadra and Nagar Haveli and Daman and Diu recorded 706. The national figure was 943.
Rural areas accounted for 68.86% of the final census count. Among states, Goa had the highest urban share at 62.17%. In Delhi, a union territory, it was 97.50%.
Delhi counted 11,320 residents per km², the highest density on the state and union territory roster. Bihar had the highest density among states at 1,106 residents per km².
About 39.8% of India’s residents were counted as workers. Among workers, 29.95% were agricultural labourers and 24.65% were cultivators.
Nationally, 67.25% of households used electricity for lighting, 31.97% reported treated tap water as their main drinking source and 46.92% reported a latrine within their premises.
Population, literacy, sex ratio, residence, work and social-group figures use the final Primary Census Abstract (PCA) from the Office of the Registrar General & Census Commissioner, India. Published final national literacy is 72.99% (73.0% to one decimal). Dividing the final national PCA workbook’s 763,638,812 literate residents by its 1,046,339,724 residents aged seven and over gives 72.98%, the value used in the explorer. The early release reported 74.04% literacy and a 31.16% urban share. Final counts give 31.14% urban and 68.86% rural.
The 2011 Census reported 35 states and union territories. Andhra Pradesh and Telangana were separated in 2014. We reapportioned final PCA counts using Khammam’s census villages and towns and the amended transfer schedule. Housing, religion, language and growth use whole Census 2011 districts for these two states, with the full 2011 Khammam district assigned to Telangana. These measures are marked on the map and in the profiles.
In 2019, Leh and Kargil became Ladakh, and the rest of the former state became the union territory of Jammu and Kashmir. The two territories use published area conventions. The Dadra and Nagar Haveli and Daman and Diu territories merged in 2020. Their census counts are added before rates are calculated. Ministry of Home Affairs annual report.
State polygons are simplified from Vardhan Maps’ OpenStreetMap-derived boundaries. Vardhan’s map approximates the Government of India’s depiction. See the Survey of India political map for the official depiction. The simplified geometry is available under the ODbL. Lakshadweep is clipped to Natural Earth land so territorial waters remain unshaded. District dots are representative points within 2011 polygons from the Data{Meet} Community Maps Project, CC BY 2.5 India.
Literacy rates use residents aged seven and over. Main, marginal and work-category shares use all workers as the denominator. Electricity means the main lighting source. Treated tap water records a reported source, with no water-quality testing. Clean cooking fuel includes LPG, piped natural gas, electricity and biogas. Housing shares exclude institutional households. Languages follow the census’s mother-tongue groupings.
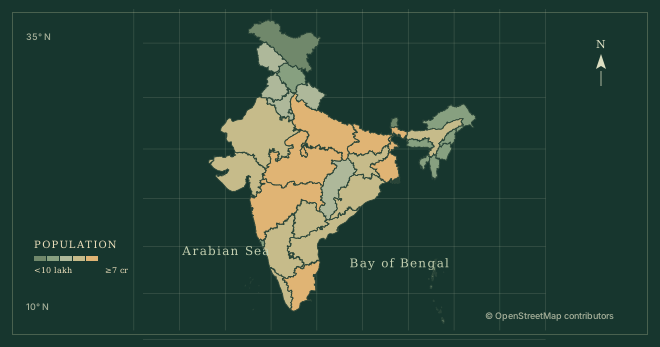
Map colours use fixed, labelled breaks for each measure. The sex-ratio maps show how regions fall above or below the national ratios. The ranking’s reference line shows the all-India rate or the mean across the 36 regions for counts. The district dots show population on the original 2011 district roster.
The Ministry of Health and Family Welfare’s Technical Group projected population by sex and residence for 1 October 2026, using Census 2011 as its base. We use tables 14 and 15, which publish counts in thousands. The combined union territory adds the published projections for Dadra and Nagar Haveli and Daman and Diu. Urban share is calculated from the published urban and total projections. The published India total is 1,429,511,000. The 36 regions sum to 1,429,494,000, a difference of 17,000. All 2026 values are model estimates.
Census 2011 is India’s latest completed national population census. The Office of the Registrar General & Census Commissioner lists the Census 2027 programme and its phases on its official website.
The Ministry of Health and Family Welfare’s Technical Group projected 1,429,511,000 people, or 142.95 crore, for 1 October 2026. This is a government model estimate based on Census 2011.
The final Primary Census Abstract counted 1,210,854,977 people, or about 121.09 crore (1.21 billion). Uttar Pradesh was the most populous state, with 199,812,341 people.
Kerala led the states at 94.0%. Bihar recorded the lowest rate among states at 61.8%. Census literacy rates apply to people aged seven and over.
The provisional census reported 74.04%. Published final summaries report approximately 73.0%, including the National Commission for Scheduled Tribes’ figure of 72.99%. The final Primary Census Abstract counts give 72.98% when divided directly.
India recorded 943 females per 1,000 males. The overall sex ratio uses the full counted population. The child sex ratio uses children aged zero to six.
The final census counted 377,106,125 urban residents (31.14%) and 833,748,852 rural residents (68.86%). The earlier provisional release reported 31.16% urban and 68.84% rural.
The map uses the post-reorganisation roster. The 2011 Census recorded 35 regions before the Andhra Pradesh and Jammu and Kashmir splits and the merger of Dadra and Nagar Haveli with Daman and Diu.
Census table A-01 reported 382 people per square kilometre on its published area basis. Delhi was the densest union territory and Bihar was the densest state.